As of February 28, 2026, the global financial landscape is reacting to the immediate onset of military operations involving Iran. Historical conflict patterns suggest that precious metals act as the primary “insurance policy” for capital, and the current rally reflects a massive injection of geopolitical risk premium into spot prices.
1. Western Institutional Forecasts: Targeting New Frontiers
Major Western banks have aggressively revised their targets as gold breaches historical resistance levels.
- J.P. Morgan: Analysts have raised their 2026 gold forecast to $6,300 per ounce, representing a nearly 25% upward revision. This model assumes that gold is transitioning from a “crisis hedge” to a permanent portfolio component in an era of high geopolitical volatility.
- Goldman Sachs: Maintaining a bullish stance, Goldman Sachs expects gold to average $5,400 per ounce by year-end 2026, citing unexhausted central bank demand and the “insurance value” of commodities against supply disruptions.
- Technical Targets: Analysts at Blue Line Futures and OANDA note that if gold sustains its position above $5,300, the next major resistance level sits at $5,450, with some bull-case scenarios eyeing $6,000 if the conflict widens.
2. GCC Market Perspective: Local Resilience and Volatility
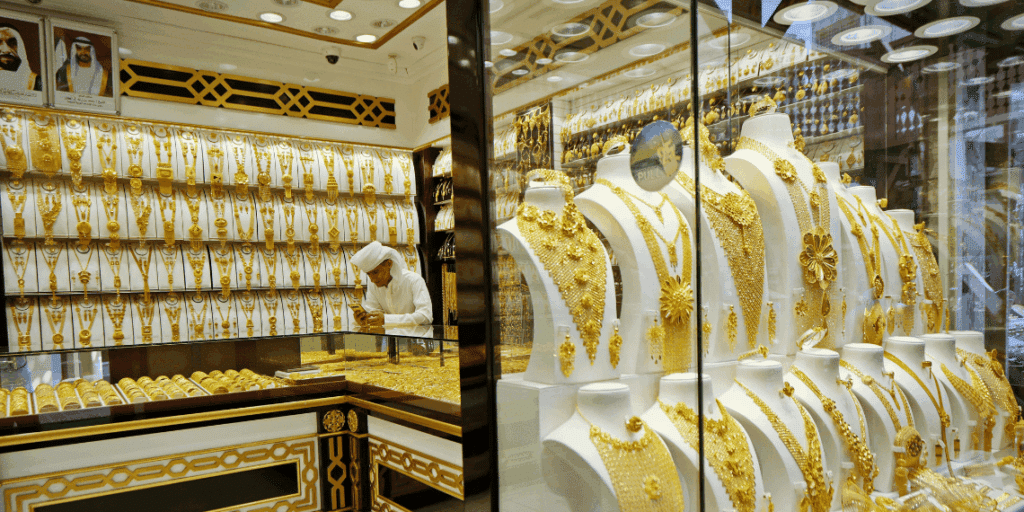
In the GCC, where gold holds deep cultural and financial significance, the market reaction has been swift.
- Flight to Safety: Financial experts in Dubai and Doha report a “gap-up” opening for precious metals following the initial strikes. Local demand is driven by a desire to hedge against regional currency volatility and potential disruptions in the global oil trade.
- Regional Premiums: Reports from regional exchanges show that while global spot prices are volatile, local physical premiums remain high as private investors in the Gulf prioritize physical gold ownership over paper ETFs to avoid digital counterparty risk.
3. The Silver Paradox: Industrial vs. Safe-Haven
Silver’s trajectory in 2026 is more complex than gold’s due to its dual nature as both a monetary and industrial metal.

- Explosive Potential: Silver has approached $93 per ounce in late February, with some analysts suggesting a push toward $120 if the safe-haven “flight” intensifies.
- The Vulnerability: Analysts warn that silver lacks the “structural floor” provided by central bank buying. Because a significant portion of silver demand is industrial (solar, electronics), a war-induced global economic slowdown could dampen industrial demand, making silver more volatile than gold in a prolonged conflict.
4. Central Bank Accumulation: The Structural Floor
A key driver cited by both Western and GCC sources is the relentless accumulation of gold by central banks, which provides a long-term price support regardless of the war’s duration.
- De-dollarization Acceleration: In 2025, central banks added over 860 tonnes to their reserves. This trend is expected to accelerate in 2026, with central banks in China, India, and the Middle East viewing gold as the only neutral reserve asset outside the reach of international sanctions.
- Structural Support: This official-sector buying acts as a permanent support level, preventing a total collapse in prices even if a de-escalation occurs.
Precious Metals Price Expectations (Q1 2026 Update)
| Asset | Current Range (Feb 2026) | Target (Base Case) | Target (War Case) |
| Gold (per oz) | $5,250 – $5,300 | $5,055 | $6,300 – $8,000 |
| Silver (per oz) | $90 – $93 | $75 | $120 – $200 |
| Market Driver | Geopolitical Shock | Central Bank Support | Wider Regional Conflict |