No one could have foreseen what the world is going through as a result of the COVID-19 pandemic. Trying to compare our days with any earlier period in history seems senseless, as so many parameters have changed drastically, whether you take the Spanish flu, the great depression, the globalization of the past decades or the financial crisis of 2008/9 as your point of reference. And yet – however terrible the daily news – you may want to know what’s happening in your field of economic activity, if only as some kind of background to the momentous things happening to us or around us.
You are accustomed to our monthly information built with the full worldwide data of well over 70 airlines. Today, subscribers to the WorldACD data service received the March-data for over 1,500 individual markets: the word roller-coaster does not even begin to describe what the air cargo world has experienced in March.
March 2020 vs March 2019 (YoY)
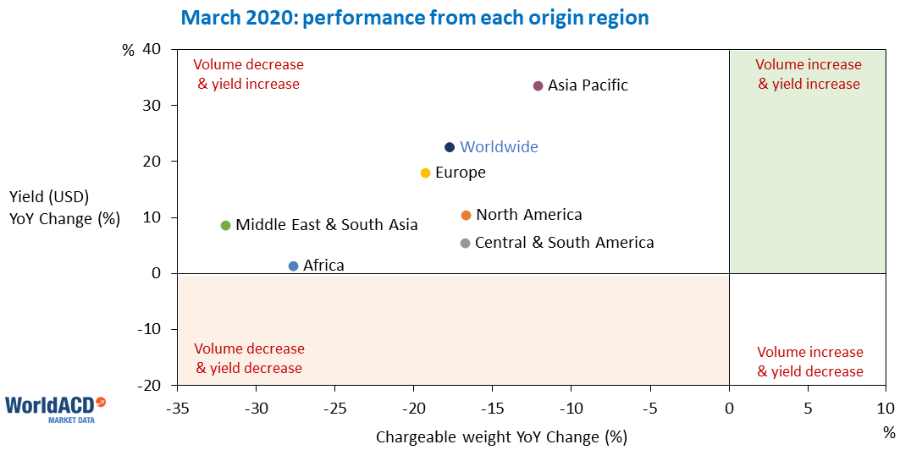
After the 2.7% drop we reported for the months of January/February combined, March recorded a decrease in chargeable weight of 17.7%, in spite of the first week of March being the best week of the year so far. Asia Pacific (-12%) and the Americas (-17%) fell least, whilst Africa and MESA were hardest hit (-28% and -32% respectively). A small increase in freighter capacity (+2%) was more than offset by the sudden lack of cargo capacity in passenger aircraft (-39%), causing yields to go up in most regions, most visibly for cargo originating in Asia Pacific. In that region, unit prices in USD increased YoY by more than 1/3 (from China by even 2/3, getting up to an average of 3.58 USD/kg). In terms of revenues (in USD), the market from China to destinations in Asia Pacific stood out with an increase of 91%.

March vs February (MoM)
Between February and March, freighter capacity increased by 29%, whilst cargo capacity on passenger aircraft dropped by the same percentage. Changes in cargo carried were most conspicuous when looking at the results per type of airline. Airlines flying freighters only, carried 42% more cargo than in February, whilst airlines operating only passenger aircraft lost 22%. The larger group of airlines operating both passenger aircraft and freighters, did not suffer a material change in volume. Not surprisingly, the cargo-only airlines improved their market share considerably, whilst recording a whopping 81% growth in USD-revenues.
Forwarders from the World’s Top-20 had different experiences: the Top-10 as a group increased volumes by 3%, though with individual performance ranging between -9% and +16%. Individual performances in Tier-2 (the numbers 11-20 lost 2% as a group) were much more divergent, ranging from -40% to +117 %. The Top-10 slightly increased their share as they laid their hands on scarce capacity against a somewhat higher increase of charges than the increase recorded for Tier-2.
The month of March, a month like no other in aviation history
Where to start when recording the events within the month of March, showing many completely different faces…
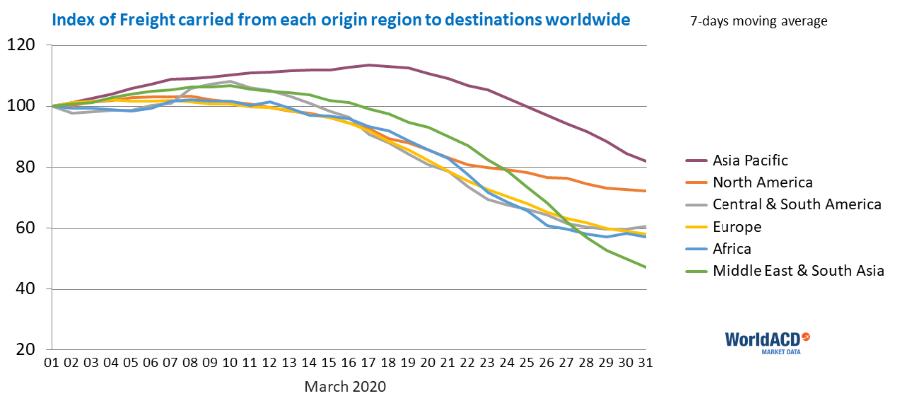
Freight capacity fell by 28% in two weeks’ time. Cargo carried on freighters was 3.5% higher in the second half (H2) than in the first (H1), but freight carried on passenger aircraft was halved, causing the total freight carried to drop by 22% from H1 to H2. Cargo carried from Africa and MESA fell by more than 30% in two weeks’ time, Asia Pacific’s by less than 10%.

Comparing the last week of March with the first, a mixed picture emerges. Cargo carried in the last week was 31% lower worldwide than in the first week. Airlines from the Middle East were hardest hit with a volume decrease of 49%. Cargo capacity on passenger aircraft virtually disappeared in the MESA region (-92%). Asia Pacific airlines dropped least (-10%). Airlines from North America lost 53% in European markets, but airlines from Europe only 28% in North American markets.
The volume of high-tech transported in the last week of March, was higher than in the first week. Fish & Seafood, Fruits & Vegetables and Flowers were hardest hit, with drops between the first and the last week of 41%, 53% and 58% respectively.


